When an API feels slow, teams usually jump straight to backend explanations: inefficient queries, heavy validation, downstream calls, “we need caching”. Sometimes that’s true. But very often the backend is not the main problem. The main problem is that a large part of the total time is spent on the wire.
Rentgen’s Network Share Calculation exists to answer a practical question that most teams never quantify: how much of the “API response time” is actually network latency.
What this insight is — and what it is not
This is not a new performance benchmark and it is not a load test. It is a simple ratio, calculated from signals Rentgen already measures during a normal run. The goal is not to blame backend code. The goal is to avoid wrong conclusions.
If network latency consumes a large share of the total response time, your “performance problem” might be routing, region mismatch, or an expensive network path. Optimizing backend code won’t fix that. Moving closer will.
What was tested
Rentgen collects two values during a test run: the best (lowest) ping result from 5 attempts, and the median API response time calculated across the generated requests. Then it computes one percentage.
- TEST: Network Share Calculation
- Data: best ping (lowest of 5) + median response time
- Formula:
(bestPingMs / medianResponseMs) * 100
To avoid noise on ultra-fast endpoints, this insight only becomes relevant when the median response time is at least 300 ms.
If your API is already responding under 300 ms, the network share is usually not the limiting factor and there is nothing useful to flag.
How Rentgen interprets the result
The output is intentionally simple: Rentgen shows best ping, median response, and the calculated network share percentage. Then it classifies it using clear thresholds.
- Pass: network share
< 30% - Warning: network share
30–49% - Fail: network share
≥ 50%
What Rentgen found
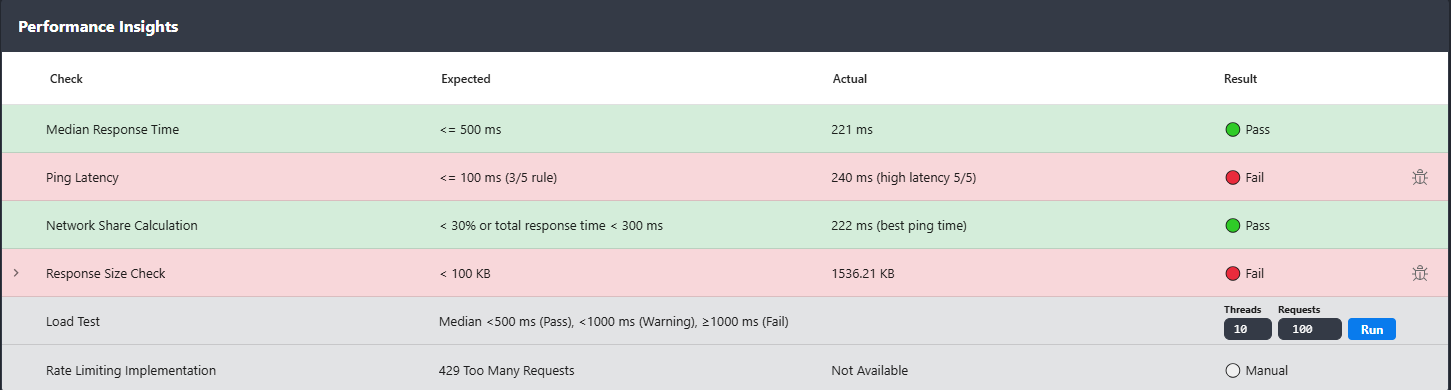
- TEST: Network Share Calculation
- Expected: network share
< 30%or median response time< 300 ms - Actual: best ping
222 ms - Status: 🟢 Pass
Why this matters
Because the same response time can mean two completely different realities. A 500 ms median response might be a slow backend. Or it might be a perfectly fine backend behind a long network path. Most tooling does not help you separate these, so teams default to the wrong diagnosis: “backend is slow”.
Network share turns that guess into a number. If the network share is low, you know the time is spent inside the service. If the network share is high, you know most of the time is spent traveling to the service and back.
This is especially common in modern setups where “same environment” is not always true in practice. People run tests from laptops on VPN, from CI runners in a different region, behind corporate proxies, or through WAF/CDN chains that silently add hops. Everything still works, but performance analysis becomes misleading.
Why most tools don’t show this
Most tools either focus on functional checks (send a request, assert a response) or on load testing (generate traffic, measure throughput). The “in-between” question rarely gets answered: what portion of a typical request is just network travel time?
Rentgen can show it because it already executes a large, varied set of real requests and measures median response time by default. Adding ping next to that is not a separate workflow. It is one view, one run, one interpretation.
How to react to Warning or Fail
If the network share crosses the thresholds, treat it as a signal to inspect the environment, not the application. Check where the tests are executed versus where the API is hosted, and whether routing is doing something unexpected. Often the fix is reducing hops, correcting region mismatches, or removing unnecessary layers from the path.
When this insight flags a problem, Rentgen provides a Copy Bug Report action next to it. It includes the calculated values, ping sample results, and a request example, so you can share a complete picture without writing an explanation from scratch. The point is not paperwork. The point is faster diagnosis and fewer wrong debates.
Final thoughts
“API is slow” is not a diagnosis. It is a symptom. Network Share Calculation helps you stop guessing and start separating the two biggest contributors to perceived latency: backend time and network time.
It’s a small metric, but it prevents a lot of expensive, pointless work.